


Data and Insights at Bionic – what it actually means to be Data Driven?
Before sitting down to write this piece I thought at length about what to discuss… Firstly, I considered discussing something abstract and conceptual (what is data, what is big data…?), that could be interesting.
Then I wondered if it would be better to discuss a pertinent technical question (what is the best ETL tool to use? How should we structure and architect our data?). This is very relevant but potentially narrow in focus. What about something practical? (eg why we chose to use a Random Forest model etc). These are all very interesting topics but as this is the first data blog I thought it would be best to start at a beginning of sorts – and that would be to answer a question that I get a lot from family and friends and is directly relevant to the D&I and Tech team here at Bionic.
The question I get is: what is it that you actually do? My normal quick answer – is “I.T.”, if pushed I might then mention data before quickly changing the subject. What I am thinking about is making Bionic more data driven.
Background on me: I have worked in data, research and insights for 20+ years. I started out loading in patchy data from 4-track cassettes (like video tapes) and trying to examine trends while coding in early DOS versions of SAS (statistical software behemoth of old). We produced some insights and I did some statistical analyses. These took a few days to run. Since then the industry has changed and continues to change unimaginably quickly. The volume of data that can now be stored and analysed (in real time) to develop highly sophisticated personalised algorithms governing your experiences, say on Amazon, Spotify or used in more technical areas like North Sea oil drilling, are mind blowing. The graph below illustrates the growth in data in only the last 10 years.
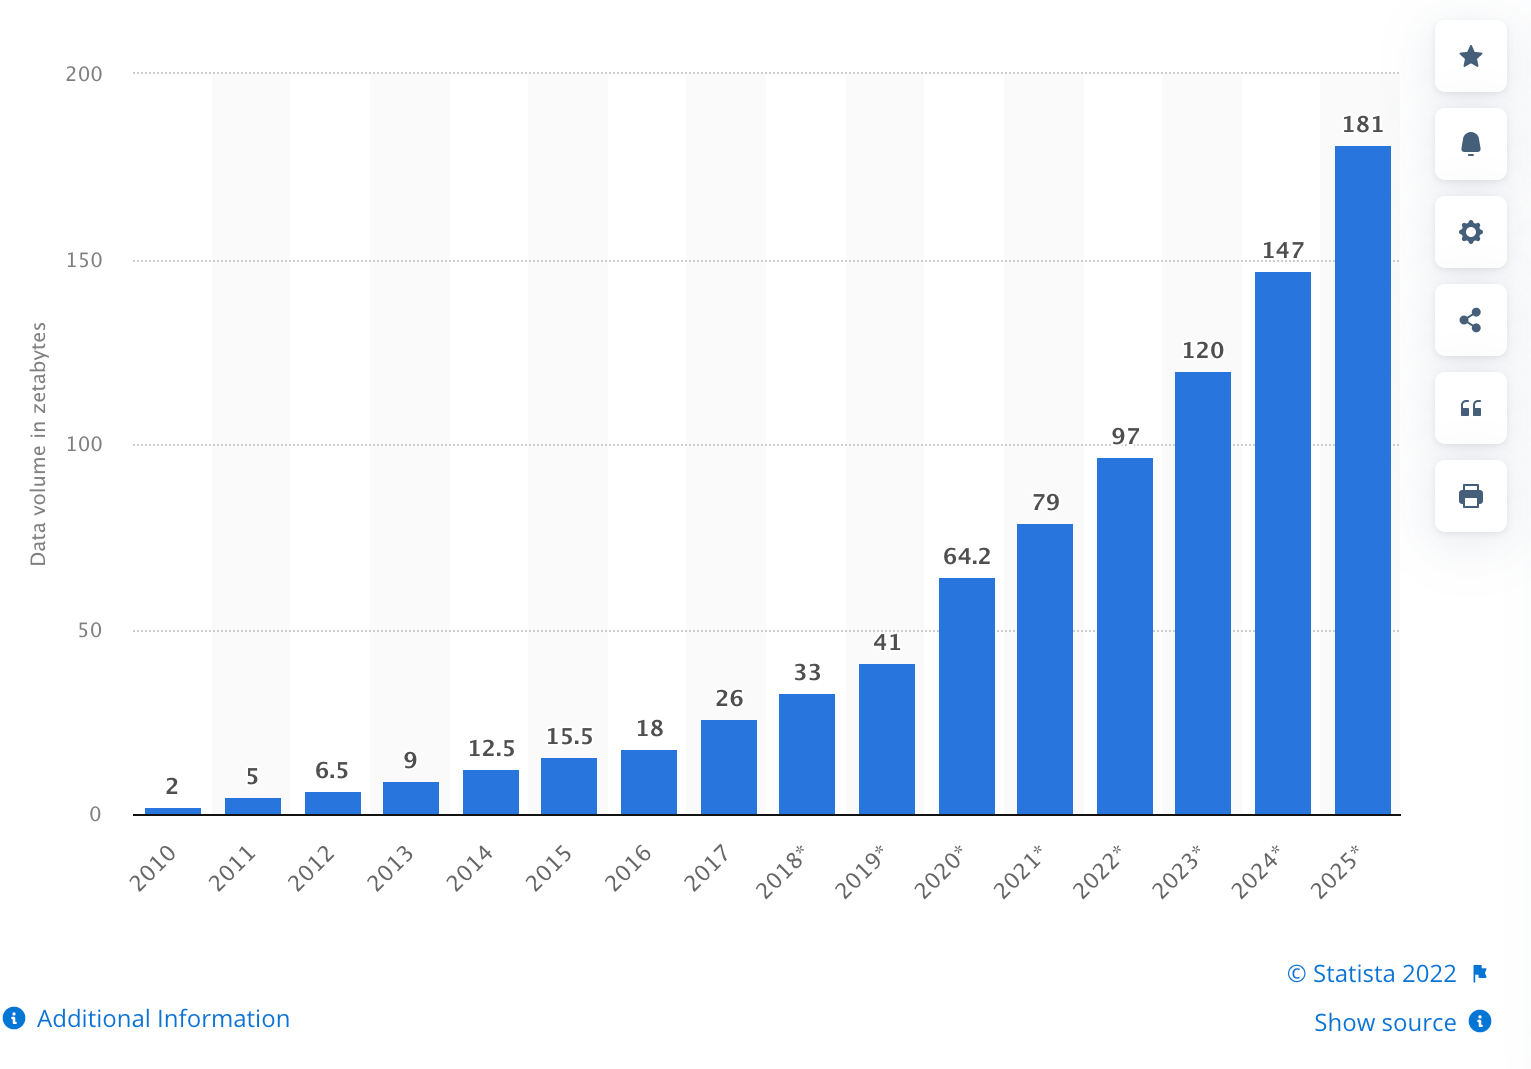
Volume of data/information created, captured, copied, and consumed worldwide 2010 to 2025(1 zettabytes = one billion terabytes.)
Data Driven: Here at Bionic I am head of Data and Insights team. Our job is to harness modern technologies and our data to deliver analysis that drives long term commercial and IP value to the company. At Bionic we are lucky enough to have access to 1st party (that means it comes directly from source – eg customers) and we aim to advise the company not only on what is best thing to do but when is the right time to do it and to who with the right product and in the right way. In other words, we want to ensure that all decisions are based on robust analysis. This is our definition of being data driven...
The Team and Stakeholders: To do this we have built a Full Stack team – that means that we are responsible for all steps from loading and arranging the data to analysing it. We work across with all stakeholders as “the source of truth” – Sales teams, Finance, Marketing, Commercial, and Product areas (Energy, Telco, Finance and Insurance) across the Bionic Group.
ETL: The first step in our process is: Extracting, Loading and Transforming data (aka ETL - imagine downloading a stream of characters and numbers from multiple sources and then collecting them together in neat, intelligible columns in a spreadsheet). In Bionic’s case most of the data comes from Salesforce (as sales agents have collected information, they need to help the customer) and Sales and Contract data but we have additional sources (eg web behaviour, 3rd party apps) which provide helpful additional information. Once the data is loaded, we run checks to make sure it is sensible and correct (is it possible we did £4b in sales yesterday? Unfortunately, it is unlikely). These are the foundations of all work (your analysis is only as good as the data) so we must make sure we are storing data in a suitable, safe and accessible location. In our case we have a Datawarehouse run on a common and secure cloud platform (AWS).
Reporting and Insights: Once the data is loaded, we can see, amongst other things, how many sales were made by each team and how much revenue was generated per day/week/month etc. This helps the business and different teams’ trends. Often this is in the form of reporting (we use SQL coding and Tableau KPI reporting) but we also do ad-hoc pieces of insight (eg why did we see so many new customers last month?). This allows us to better understand why things have happened.
Predicting the future: Part of being data driven is using past trends to predict the future. This can range from making recommendations on a customer journey (we saw that conversion was 10% better if you do X over Y) or more advanced statistical modelling (using Python) to predict the best people to target with a campaign. We use these insights, working with the wider tech and commercial functions to inform key decisions on journeys or targeting. We then evaluate the results, learn and optimise to improve the modelling, outcomes and recommendations.
So, as a business becomes more “data driven” we move from being a more reactive and diagnostic function or order takers (“I need this number in this report etc”) to being a more predictive and pro-active (“Hey, do you know if you target this group of customers, you will likely improve contact rate by 10%!?”)
Ways of working: To become data driven takes time. At Bionic we are building and developing the team thereby increasing capability, choosing technology, and developing clear processes/guard rails. In addition, we are balancing the ethics of holding and using data. As someone said to me a while ago “you can go from cool to creepy pretty quickly”. Perhaps though, and often overlooked, is the need to develop ways of working between tech and the wider business as the interactions usually involve process change – so we are building trust with stakeholders!
In Summary: The answer to the question “what do I do?” is that we are working towards using data and insights in all decisions in the company. How are we doing? If 5/5 is fully data driven Bionic is around 2.5/5 at the moment (we have a lot of good customer data, we can explore and do some predictive analytics from it and the reporting is good). We are on the journey towards 3+ by the end of the year – with a new data architecture and customer insights projected planned.
If anyone is interested in finding out more, please don’t hesitate to drop us a line, we are keen to learn more and share experiences with other organisations out there, all on their own data journey.