


How quickly is your city going green?
Global warming isn’t something that’s going to happen - it’s here, happening right now. More and more businesses across the world are fighting to combat it, introducing new green technologies designed to reduce their carbon footprint and ensure we have a world to enjoy for many generations to come.
We wanted to see where in the world this was happening the fastest.
We’ve looked at worldwide cities’ pollution levels, electric vehicle uptake, renewable energy usage and more to discover the answer.
We’ve looked at worldwide cities’ pollution levels, electric vehicle uptake, renewable energy usage and more to discover the answer.
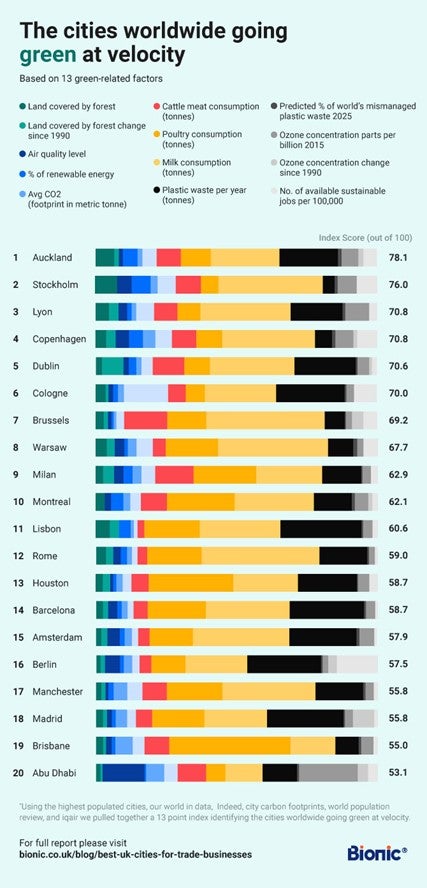
The top 20 cities going green at velocity
We looked at the 40 most populated cities across the globe and scored them using 13 metrics, to discover who was going green fastest. These metrics included:
- Countries’ land covered by forest and how that has changed since 1990
- Air quality level in each city (0-50 is good, 150+ is not good)
- Countries’ percentage of energy that is renewable
- CO2 footprint per metric tonne (annually)
- Countries’ meat, poultry and milk consumption in tonnes
- Countries’ annual plastic waste in tonnes
- Predicted percentage of worldwide mismanaged plastic waste 2025
- Ozone concentration parts per billion 2015 and ozone concentration change since 1990
- Countries’ number of available sustainability jobs per 100,000
Has your city made the list?
1. Auckland, New Zealand
Auckland is one of New Zealand’s major cities, offering incredible views of the sea and a thriving metropolis for locals and visitors to enjoy. But unlike other large cities across the world, its size hasn’t held it back when it comes to going green.
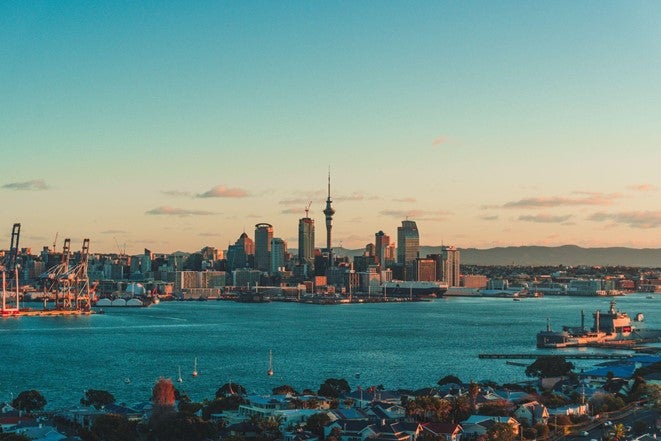
37.60% of the area is covered by forest, a figure that has actually grown by 6% since 1990. The energy it uses is 35.40% sustainable, while there are 21 jobs in the sustainability industry per 100 people.
Auckland is certainly a city moving in the right direction, lowering its carbon footprint to 5.9 metric tonnes. Its air quality level is 9 - for reference, the lower the number here the better.
2. Stockholm, Sweden
Given that 68.70% of the city of Stockholm is covered by forest, it’s no surprise to see that it’s so green. Sweden has been a big advocate for climate change controls throughout its history, and its capital city is leading the way.
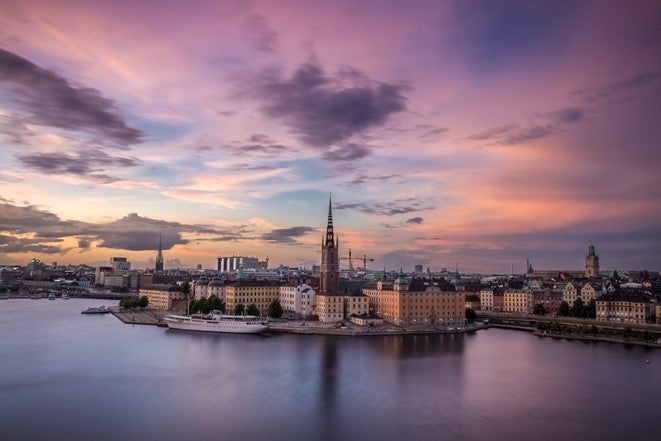
42.24% of all the city’s energy is sustainable, second only behind Sao Paulo where it’s 45%. By 2025, it’s predicted Stockholm will only contribute 0.0016% to the world’s wasted plastic total, a figure everyone should be looking to emulate.
3. Lyon, France
Since 1990, Lyon has seen its forest grow by 20%, and that’s just the start of its journey to becoming a more sustainable city.

The quality of the air in the French city sits at 43, which is towards the better end of the spectrum, while by 2025 they’re predicted to only contribute 0.0013% of waste plastic to the world’s total.
4. Copenhagen, Denmark
Copenhagen has work to do to become fully green, but it’s doing it fast. The air quality levels there are currently a little high at 112, but they’re looking to change that with 30.16% sustainable energy and 30 jobs per 100 people within the sustainability sector.
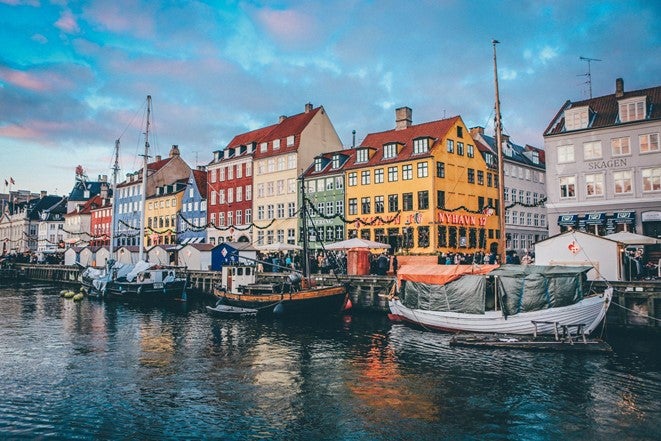
The Danish capital has seen its forest grow by 18% over the past 32 years, as more trees are planted to help absorb CO2.
5. Dublin, Ireland
The Irish capital has seen a greater amount of forest growth since 1990 than any of the other cities we analysed - at 69%, the land is quickly being given back to nature.
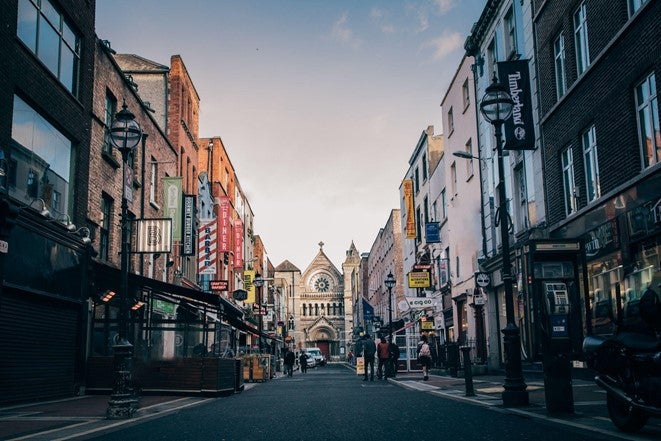
Its ozone concentration per billion - the amount of the atmosphere taken up by carbon - is only 48, contributing to its good air quality levels of 30.
Which capital city has the highest percentage of renewable energy?
Given 42.24% of Stockholm’s energy is renewable, you’d think the Swedish capital would take the title. However, the number one spot instead goes to Sao Paulo, the capital of Brazil.
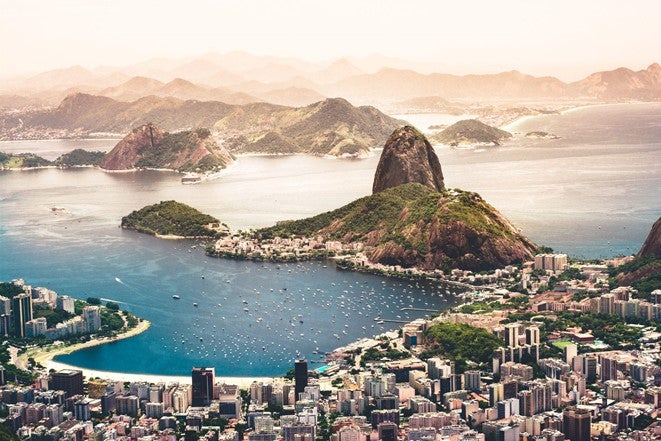
45.02% of energy there comes from sustainable sources, helping the city come back from a history of poor pollution. The city is still covered by 59.40% of forest, but that number has been decreasing rapidly since 1990, with 16% of it being lost. That slump needs to stop if it’s hoping to keep competing on a global climate change stage.
Manchester ranked second for air quality
The only UK city to make the top 20, Manchester’s air quality levels are as low as 4, only behind Sydney who score an incredible 3.
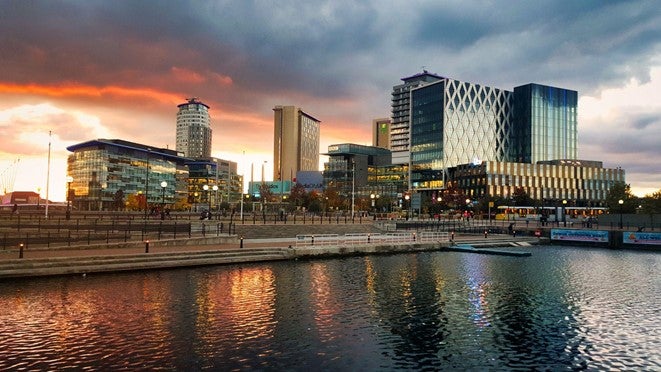
Manchester benefits from a fully electrified tram network running throughout the city, bringing people together without the need for fuel-powered cars. It’s also seen a 15% increase in forest size since 1990, helping it to leave a relatively low carbon footprint of 33.2 metric tonnes.
The worst city for air quality is Dubai. The city suffers badly from sandstorms and pollution, contributing to its levels of 129.
How to make your business more environmentally friendly
Making your business more environmentally friendly doesn't need to cost the earth. Making a few small changes can have a big impact. That’s why we’ve conjured up some simple and savvy ways to help make your business more sustainable. See how many you can put into practice now.
To switch business energy, call our tech-enabled team on 0800 144 8334 or give us your postcode on our business energy page and we'll call you right back.
Methodology
For the indexes we created, data was used to determine which cities in the world and the UK were going green at velocity. This study was based on data from OurWorldInData to determine percentage of countries covered by forest and the change in forest coverage since 1990, percentage of energy each country uses which is renewable, average amount of cattle, poultry and milk each city consumes, plastic waste per year and the amount of the worlds mismanaged plastic waste each city is accountable for and the Ozone concentration + the Ozone concentration change since 1990. Data was also used to find the air rating and CO2 levels in each city. Data from Indeed to find which cities have the most open sustainable jobs advertised. Data was gathered, and ranked accordingly and of an equal weighting to give a fair outcome on which city is going green at velocity in the UK and Worldwide.
THE TOP 40 CITIES WORLDWIDE GOING GREEN AT VELOCITY
| Ranking | City | Land covered by forest | Land covered by forest change since 1990 | Air quality level | Percentage of energy that is renewable | CO2 (footprint Mt CO2) | Beef and buffalo (cattle) meat consumption (tonnes) | Poultry consumption (tonnes) | Milk consumption (tonnes) | Plastic waste per year (tonnes) | Predicted percent of worlds mismanaged plastic waste 2025 | Ozone concentration parts per billion 2015 | Ozone concentration change since 1990 | Number of available sustainable jobs per 100,000 | Going green Index out of 100 |
| 1 | Auckland | 37.60% | 6.00% | 9 | 35.40% | 5.9 ±2.5 | 34,435 | 57,485 | 226,784 | 177,314.00 | 0.0067% | 35 | 3.00% | 21.61 | 78.1 |
| 2 | Stockholm | 68.70% | >-1% | 132 | 42.24% | 9.1 ±4.4 | 40,734 | 27,872 | 572,942 | 26,996.50 | 0.0016% | 46 | -2.00% | 43.66 | 76.0 |
| 3 | Lyon | 31.50% | 20.00% | 43 | 11.73% | 6.7 ±3.1 | 40,456 | 40,019 | 421,707 | 121,506.50 | 0.0013% | 57 | -2.00% | 10.24 | 70.8 |
| 4 | Copenhagen | 15.70% | 18.00% | 112 | 30.16% | 11.4 ±4.7 | 34,774 | 39,706 | 379,937 | 22,347.50 | 0.0023% | 50 | 2.00% | 30.07 | 70.8 |
| 5 | Dublin | 11.40% | 69.00% | 30 | 15.45% | 9.2 ±4.2 | 25,509 | 32,429 | 366,565 | 179,059.20 | 0.0050% | 48 | 2.00% | 8.6 | 70.6 |
| 6 | Cologne | 32.70% | 1.00% | 33 | 17.48% | 69.6 ±17.1 | 16,953 | 22,137 | 294,140 | 196,267.70 | 0.0007% | 55 | 0.00% | 98.77 | 70.0 |
| 7 | Brussels | 22.80% | 3.00% | 10 | 6.94% | 10.2 ±5.5 | 29,029 | 26,687 | 498,274 | 57,521.90 | 0.0018% | 54 | 10.00% | 42.38 | 69.2 |
| 8 | Warsaw | 31.00% | 7.00% | 74 | 6.18% | 13.4 ±5.3 | 5,832 | 54,374 | 368,579 | 64,192.70 | 0.0019% | 55 | -2.00% | 27.81 | 67.7 |
| 9 | Milan | 32.50% | 26.00% | 108 | 16.29% | 30.4 ±9.6 | 49,002 | 59,457 | 777,480 | 151,548.70 | 0.0037% | 74 | -9.00% | 15.11 | 62.9 |
| 10 | Montreal | 38.70% | >-1% | 37 | 27.64% | 28.3 ±7.4 | 77,533 | 166,870 | 803,003 | 128,111.70 | 0.0022% | 57 | -2.00% | 9.66 | 62.1 |
| 11 | Lisbon | 36.20% | -3.00% | 74 | 24.45% | 8.3 ±3.7 | 53,064 | 91,317 | 612,283 | 300,366.30 | 0.0088% | 54 | -7.00% | 5.46 | 60.6 |
| 12 | Rome | 32.50% | 26.00% | 29 | 16.29% | 16.1 ±5.8 | 66,875 | 81,144 | 1,061,060 | 206,824.90 | 0.0050% | 74 | -9.00% | 3.35 | 59.0 |
| 13 | Houston | 33.90% | 2.00% | 4 | 8.71% | 23.5 ±9.1 | 86,224 | 129,476 | 592,244 | 262,744.10 | 0.0034% | 67 | -4.00% | 13.76 | 58.7 |
| 14 | Barcelona | 37.20% | 34.00% | 45 | 16.97% | 26.1 ±9.0 | 72,089 | 171,961 | 929,630 | 570,460.00 | 0.0109% | 61 | -6.00% | 7.12 | 58.7 |
| 15 | Amsterdam | 11.00% | 7.00% | 33 | 6.54% | 11.0 ±4.5 | 18,468 | 23,703 | 398,119 | 174,091.00 | 0.0034% | 53 | 13.00% | 0.15 | 57.9 |
| 16 | Berlin | 32.70% | 1.00% | 80 | 17.48% | 33.5 ±11.6 | 53,240 | 69,523 | 923,753 | 616,383.40 | 0.0021% | 55 | 0.00% | 74.83 | 57.5 |
| 17 | Manchester | 13.20% | 15.00% | 4 | 14.45% | 33.2 ±4.2 | 49,314 | 88,488 | 643,295 | 199,396.50 | 0.0057% | 49 | 20.00% | 4.3 | 55.8 |
| 18 | Madrid | 37.20% | 34.00% | 29 | 16.97% | 43.4 ±15.5 | 85,531 | 204,025 | 1,102,970 | 676,828.60 | 0.0129% | 61 | -6.00% | 6.51 | 55.8 |
| 19 | Brisbane | 17.40% | <1% | 11 | 8.57% | 31.4 ±7.1 | 88,258 | 117,801 | 579,711 | 85,413.50 | 0.0038% | 36 | 0.00% | 2.63 | 55.0 |
| 20 | Abu Dhabi | 4.50% | 30.00% | 117 | 0.77% | 29.9 ±15.6 | 11,318 | 66,936 | 204,274 | 91,753.50 | 0.0015% | 102 | 15.00% | 6.04 | 53.1 |
| 21 | Athens | 30.30% | 18.00% | 59 | 12.11% | 35.3 ±11.9 | 49,514 | 48,316 | 805,034 | 248,183.80 | 0.0092% | 69 | -4.00% | 2.16 | 50.6 |
| 22 | Toronto | 38.70% | >-1% | 83 | 27.64% | 49.1 ±11.5 | 114,454 | 246,332 | 1,185,387 | 189,117.50 | 0.0033% | 57 | -2.00% | 3.94 | 49.6 |
| 23 | Chicago | 33.90% | 2.00% | 37 | 8.71% | 152.9 ±37.2 | 99,064 | 148,757 | 680,439 | 301,870.90 | 0.0039% | 67 | -4.00% | 16.69 | 49.6 |
| 24 | Sydney | 17.40% | <1% | 3 | 8.57% | 41.2 ±10.6 | 180,520 | 240,946 | 1,185,715 | 174,700.90 | 0.0078% | 36 | 0.00% | 4.21 | 47.1 |
| 25 | Paris | 31.50% | 20.00% | 9 | 11.73% | 78.0 ±25.5 | 257,944 | 255,159 | 2,688,749 | 774,708.80 | 0.0085% | 57 | -2.00% | 6.87 | 43.7 |
| 26 | Dubai | 4.50% | 30.00% | 129 | 0.77% | 110.8 ±31.0 | 21,788 | 128,862 | 393,255 | 176,637.90 | 0.0029% | 102 | 15.00% | 6.41 | 43.3 |
| 27 | Los Angeles | 33.90% | 2.00% | 51 | 8.71% | 196.4 ±43.7 | 147,783 | 221,914 | 1,015,071 | 450,327.70 | 0.0058% | 67 | -4.00% | 8.28 | 42.1 |
| 28 | Melbourne | 17.40% | <1% | 32 | 8.57% | 44.4 ±11.2 | 183,882 | 245,434 | 1,207,803 | 177,955.30 | 0.0079% | 36 | 0.00% | 2.76 | 42.1 |
| 29 | London | 13.20% | 15.00% | 25 | 14.45% | 98.9 ±21.8 | 169,822 | 304,726 | 2,215,322 | 686,663.90 | 0.0195% | 49 | 20.00% | 11.78 | 40.0 |
| 30 | Seoul | 64.50% | -4.00% | 65 | 2.54% | 276.1 ±51.8 | 157,516 | 166,594 | 289,794 | 394,520.30 | 0.0155% | 68 | 3.00% | 1.1 | 36.0 |
| 31 | New York City | 33.90% | 2.00% | 57 | 8.71% | 233.5 ±75.4 | 303,204 | 455,297 | 2,082,606 | 923,930.70 | 0.0120% | 67 | -4.00% | 10.82 | 34.8 |
| 32 | Delhi | 24.30% | 13.00% | 195 | 7.78% | 69.6 ±16.0 | 24,370 | 71,186 | 2,709,557 | 102,354.60 | 0.0951% | 76 | 23.00% | 0.06 | 33.7 |
| 33 | Beijing | 23.40% | 40.00% | 141 | 12.66% | 83.7 ±19.1 | 119,040 | 274,773 | 696,747 | 870,140.20 | 0.3798% | 65 | 14.00% | 1.22 | 32.9 |
| 34 | Sao Paulo | 59.40% | -16.00% | 50 | 45.02% | 33.6 ±7.1 | 831,024 | 1,077,303 | 3,348,321 | 1,234,217.30 | 0.1437% | 53 | 20.00% | 0.01 | 31.5 |
| 35 | Tokyo | 68.40% | >-1% | 29 | 9.31% | 132.8 ±21.4 | 342,548 | 689,569 | 2,685,964 | 2,371,458.70 | 0.0772% | 61 | 7.00% | 3.01 | 31.0 |
| 36 | Shanghai | 23.40% | 40.00% | 95 | 12.66% | 181.0 ±44.6 | 159,124 | 367,298 | 931,362 | 1,163,142.50 | 0.5077% | 65 | 14.00% | 3.18 | 30.8 |
| 37 | Mexico City | 33.80% | -7.00% | 91 | 7.22% | 55.7 ±11.0 | 313,167 | 718,209 | 2,470,665 | 626,146.50 | 0.0571% | 59 | -5.00% | 1.01 | 30.2 |
| 38 | Istanbul | 28.90% | 12.00% | 82 | 18.47% | 70.9 ±16.0 | 201,708 | 322,732 | 3,032,493 | 1,023,386.40 | 0.2083% | 67 | 0.00% | 0.47 | 29.2 |
| 39 | Lahore | 4.80% | -25.00% | 166 | 10.64% | 10.6 ±2.6 | 116,730 | 79,355 | 2,479,903 | 378,243.40 | 0.1044% | 69 | 17.00% | 0.1 | 27.1 |
| 40 | Buenos Aires | 10.40% | -19.00% | 41 | 13.56% | 57.5 ±10.2 | 832,435 | 649,225 | 2,998,364 | 918,649.50 | 0.1537% | 40 | 11.00% | 0.51 | 26.3 |